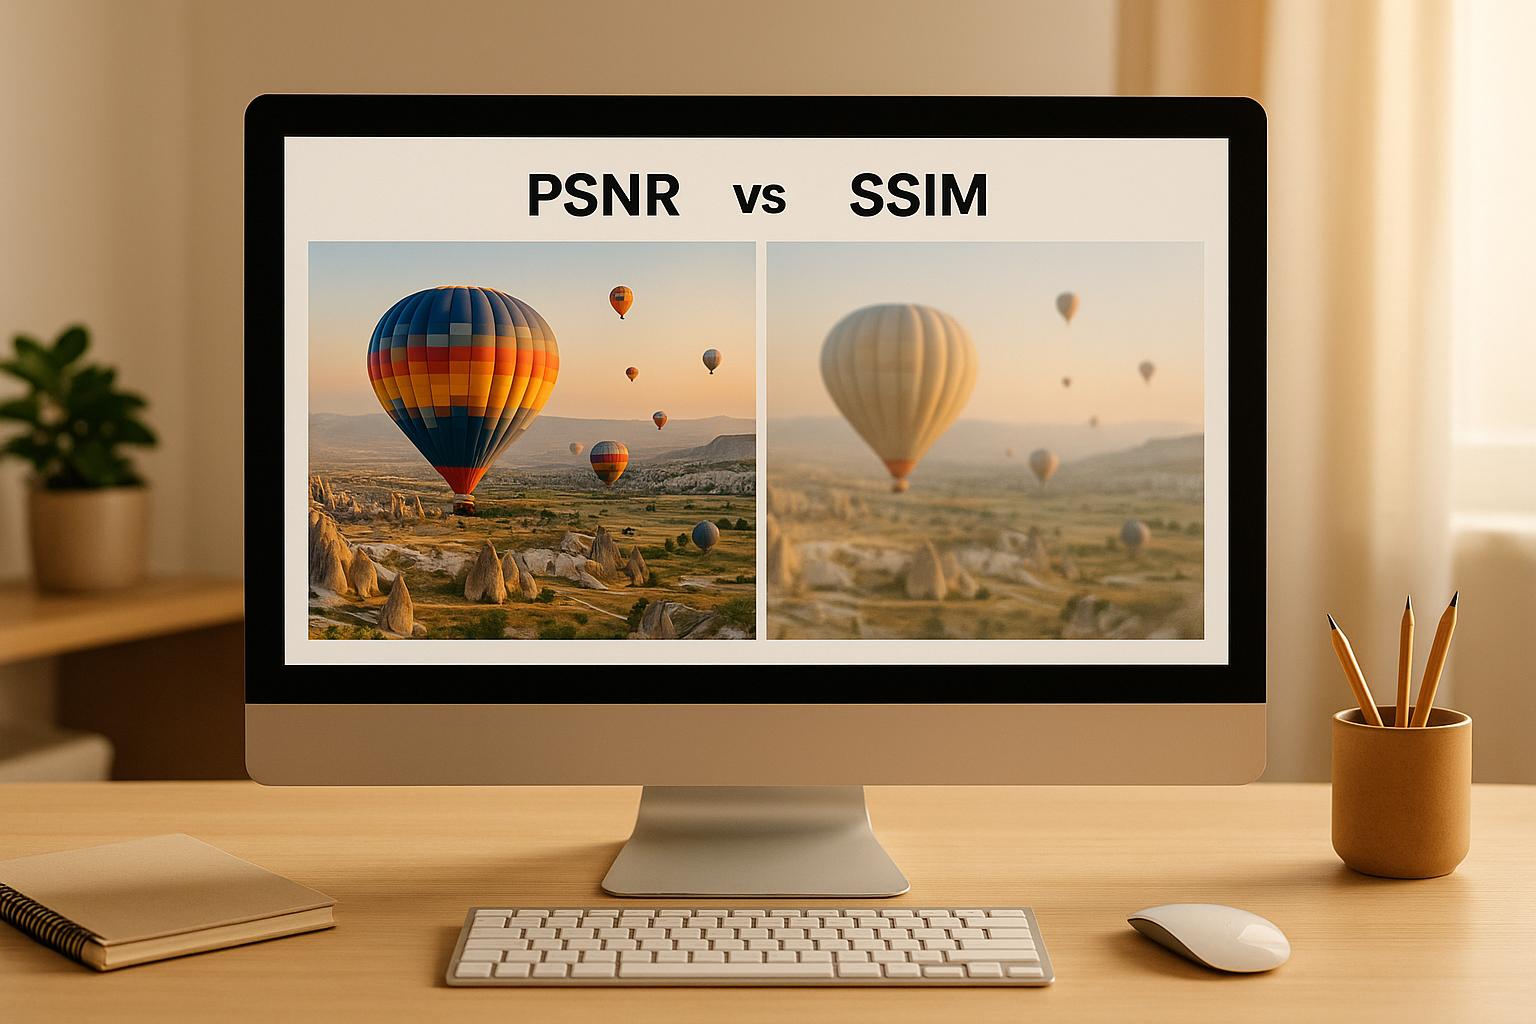
PSNR vs. SSIM: Comparing Image Quality Metrics
Explore the differences between PSNR and SSIM, two essential metrics for evaluating image quality in AI tools and their applications in image processing.
PSNR vs. SSIM: Comparing Image Quality Metrics
When evaluating image quality in AI-based tools, two key metrics stand out: PSNR (Peak Signal-to-Noise Ratio) and SSIM (Structural Similarity Index Measure). Both offer unique ways to assess how well an image has been processed, but they serve different purposes:
- PSNR measures pixel-level differences, focusing on technical accuracy. Higher values (20–40 dB or more) indicate better quality.
- SSIM evaluates structural, luminance, and contrast similarities, aligning more closely with human perception. Scores range from -1 to 1, with higher values reflecting better visual quality.
Key takeaway: Use PSNR for precise technical analysis (e.g., compression) and SSIM for assessing visual appeal (e.g., AI-enhanced images). Combining both often gives a fuller picture.
Quick Comparison:
| Factor | PSNR | SSIM |
|---|---|---|
| Focus | Pixel-level accuracy | Structural and perceptual quality |
| Score Range | 0 to ∞ (higher is better) | -1 to 1 (closer to 1 is better) |
| Human Perception | Moderate | Strong |
| Speed | Fast | Slower |
| Best Use Cases | Compression, noise analysis | AI imaging, visual quality |
For best results, balance these metrics with human feedback to ensure both technical and visual quality are met.
Image Quality Assessment
Understanding PSNR and How It Works
PSNR, or Peak Signal-to-Noise Ratio, measures noise and distortion by comparing each pixel in a processed image to its original counterpart. Essentially, it treats every pixel as a data point and calculates the average error across the entire image.
At its core, PSNR compares the maximum possible signal strength of an image to the noise present after processing. This makes it particularly useful for evaluating AI-based image tools, as it helps determine whether processing has introduced unwanted artifacts or preserved the original image's quality.
To calculate these differences, PSNR follows a structured four-step process.
PSNR Calculation Method
The calculation of PSNR transforms pixel differences into a meaningful quality score. Start with two images of the same size: the original and the processed version.
The process begins with the Mean Squared Error (MSE), which calculates the average squared difference between corresponding pixels in the two images. For an image with dimensions of m rows and n columns, the MSE formula is:
MSE = (1 / (m × n)) × Σ(i=0 to m-1) Σ(j=0 to n-1) [I(i,j) - K(i,j)]²
Here, I(i,j) represents the pixel value at position (i,j) in the original image, while K(i,j) is the corresponding pixel in the processed image.
Next, the maximum possible pixel value is determined based on the image's bit depth. For standard 8-bit images, this value is 255. For images with B bits per sample, the maximum is 2^B - 1. In double-precision floating-point images, the maximum is 1.
Finally, PSNR converts the MSE into a decibel value using the formula:
PSNR = 10 × log10((MAX_I²) / MSE)
This calculation ensures that higher PSNR values indicate better image quality, with less noise and distortion introduced during processing.
PSNR Advantages
One of PSNR’s key strengths is its speed and consistency. The metric relies on simple mathematical operations like subtraction, squaring, and logarithms, making it quick to compute even for large images. This efficiency is particularly useful when analyzing multiple images or processing large datasets, as it delivers consistent results regardless of who performs the calculation.
PSNR is especially effective in image compression scenarios where pixel-level accuracy is critical. For example, when evaluating JPEG compression or other lossy formats, PSNR provides a reliable measure of how much original pixel information has been retained. This makes it a trusted benchmark for comparing compression algorithms or settings.
Its straightforward implementation is another advantage. Engineers and developers can easily integrate PSNR calculations into workflows without requiring specialized tools or knowledge, which explains its widespread use in the image processing field.
PSNR Drawbacks
Despite its benefits, PSNR has a notable limitation: it doesn’t align well with human visual perception. The metric treats all pixel differences equally, regardless of their visual significance. For instance, a slight misalignment of edges might result in a low PSNR score, even if the image looks nearly identical to the human eye.
PSNR also struggles with structural distortions, where the overall appearance changes without significant pixel value differences. A slightly blurred image might score well on PSNR but appear noticeably degraded to viewers. Similarly, subtle texture or contrast changes might lead to poor PSNR scores, even if the image looks visually acceptable or improved.
Another issue is that PSNR doesn’t account for perceptual factors - the way humans prioritize certain types of distortions over others. Our eyes are more sensitive to specific changes, but PSNR treats all differences uniformly. This can be particularly problematic when assessing AI-enhanced images, where preserving structural details often matters more than pixel-perfect accuracy.
Finally, PSNR can be less effective for color images, as it may not fully capture distortions in color balance or chromatic shifts. These issues can significantly affect visual quality, even if they don’t result in large numerical differences in RGB values.
Understanding these limitations helps set the stage for comparing PSNR with other metrics, like SSIM, which better reflect human visual perception.
Understanding SSIM and How It Works
While PSNR measures image quality by focusing on pixel differences, SSIM (Structural Similarity Index Measure) takes a different approach. It evaluates image quality by comparing luminance, contrast, and structure, offering a perspective more aligned with how humans perceive visuals.
SSIM was designed to address the limitations of traditional pixel-based methods. Unlike PSNR, which calculates an overall error, SSIM breaks quality down into distinct components that reflect human visual processing. This makes SSIM scores more consistent with how we judge image quality. Let’s dive into how SSIM works and what makes it such a valuable tool.
SSIM Calculation Method
SSIM evaluates image quality by analyzing small patches of the image, typically 8×8 or 11×11 pixels, and focuses on three main components:
- Luminance comparison: This measures how similar the average brightness is between corresponding patches in the original and processed images. The formula is: l(x,y) = (2μₓμᵧ + c₁) / (μₓ² + μᵧ² + c₁) Here, μₓ and μᵧ represent the average pixel intensities of the two patches, and c₁ is a small constant to avoid division by zero.
- Contrast comparison: This evaluates the similarity in the variance or spread of pixel values between the two patches: c(x,y) = (2σₓσᵧ + c₂) / (σₓ² + σᵧ² + c₂) In this formula, σₓ and σᵧ are the standard deviations of pixel intensities in each patch, with c₂ as another stabilizing constant.
- Structure comparison: This measures the correlation between the two patches after removing their average brightness: s(x,y) = (σₓᵧ + c₃) / (σₓσᵧ + c₃) Here, σₓᵧ is the covariance between the patches, and c₃ is the third stabilizing constant.
These three components are then combined into a single score:
SSIM(x,y) = l(x,y) × c(x,y) × s(x,y)
The resulting SSIM value ranges from -1 to 1, where 1 indicates perfect similarity, 0 shows no correlation, and negative values suggest inverse correlation. In most practical scenarios, SSIM scores between 0.8 and 1.0 are considered good indicators of high-quality images.
SSIM Advantages
One of SSIM’s biggest strengths is its ability to align with human visual perception. Unlike PSNR, which often fails to reflect how we see images, SSIM excels at evaluating structural changes, blur, and compression artifacts in a way that resonates with human judgment.
SSIM also accounts for luminance and contrast variations, which can improve the visual appeal of an image even if pixel values differ. For example, when tools like ImageUpsize enhance images, SSIM ensures that the visual structure remains intact while potentially improving clarity and detail.
Another advantage is its ability to assess localized image quality. By computing SSIM over multiple patches, it can pinpoint areas where quality issues arise, offering more detailed feedback than a single global score. This makes SSIM particularly useful for evaluating AI-enhanced images, where the goal is to improve visual quality rather than achieve exact pixel replication.
SSIM Drawbacks
Despite its strengths, SSIM has some limitations. For starters, it involves higher computational complexity compared to PSNR. Calculating statistics across multiple image windows can be time-consuming, especially for large images or batch processing tasks.
SSIM is also sensitive to scaling and alignment errors. Even minor shifts or scaling differences between images can significantly impact SSIM scores, even if the images look visually identical. This sensitivity can pose challenges when comparing images that have undergone geometric transformations.
Another drawback is its performance under extreme lighting conditions or with images that have very low contrast. In these cases, the statistical measures used in SSIM can become unstable, leading to unreliable scores.
Additionally, SSIM depends on specific parameters, such as window size and stabilizing constants (c₁, c₂, c₃). While standard values work well for most cases, certain applications may require fine-tuning for optimal results. Lastly, SSIM may sometimes prioritize structural preservation over other aspects like color accuracy or fine detail, which could be critical in some applications.
PSNR vs. SSIM: Side-by-Side Comparison
Now that we've broken down PSNR and SSIM individually, let's compare them directly to understand how they differ. While PSNR focuses on pixel-level differences, SSIM is all about evaluating structural consistency.
Key Differences Comparison Table
| Factor | PSNR | SSIM |
|---|---|---|
| Calculation Method | Measures pixel-by-pixel error | Analyzes structural similarity (luminance, contrast, structure) |
| Score Range | 0 to infinity (higher is better) | -1 to 1 (closer to 1 is better) |
| Human Perception Correlation | Poor to moderate | Excellent |
| Computational Speed | Very fast | Moderate (slower due to window-based analysis) |
| Sensitivity to Noise | Highly sensitive | Less sensitive |
| Geometric Transformation Handling | Requires strict pixel alignment | Tolerates minor misalignments but sensitive to scaling and alignment |
| Best Use Cases | Compression evaluation, technical analysis | Perceptual quality assessment, AI-enhanced imaging |
| Industry Adoption | Common in traditional imaging workflows | Increasingly popular in AI and computer vision |
A key distinction is how each metric interprets image quality. PSNR treats all pixel-level errors equally, which can result in lower scores for slightly blurred images with no noise compared to sharper ones with minor noise. SSIM, on the other hand, prioritizes structural integrity, favoring images that maintain visual coherence. For tools like ImageUpsize, which focus on AI-driven image enhancement, understanding these differences is critical when assessing whether an upscaled image retains its visual quality.
When to Choose PSNR vs. SSIM
The choice between PSNR and SSIM depends on your specific needs:
- Use PSNR for quick, technical evaluations. PSNR is ideal for compression analysis and situations where pixel-level accuracy matters most. For example, it’s effective when comparing images with identical content but varying levels of noise or compression artifacts. Its speed and consistency make it a go-to metric for technical comparisons across different compression ratios.
- Use SSIM for assessing visual quality. When the goal is to evaluate how appealing an image looks to the human eye, SSIM is the better choice. It excels at capturing human-perceived improvements, making it particularly useful for AI-enhanced images or creative content. Fields like photography, social media, and other areas that prioritize subjective visual quality benefit from SSIM’s alignment with human perception.
In many cases, combining both metrics provides a well-rounded assessment. A high PSNR score ensures technical precision, while a strong SSIM score confirms that the image looks good to the human eye. Your priority - whether it’s technical accuracy or visual appeal - will ultimately guide which metric to rely on.
sbb-itb-b6ad462
Best Practices for Evaluating AI Image Quality
Evaluating AI-generated images effectively requires a mix of automated metrics and human judgment. This combination ensures both technical precision and visual appeal are considered.
Using PSNR and SSIM Together
To assess image quality, PSNR (Peak Signal-to-Noise Ratio) and SSIM (Structural Similarity Index) are valuable tools. Each serves a unique purpose: PSNR focuses on technical accuracy, while SSIM evaluates how closely the image aligns with human visual perception.
When interpreting results, look for patterns in the scores. For instance, a high PSNR paired with a lower SSIM might suggest technical accuracy but issues with structural consistency. On the other hand, a high SSIM with a lower PSNR could indicate the image looks visually pleasing despite minor technical flaws.
The emphasis on these metrics should align with the project’s goals. If precise details are crucial - like in medical imaging - PSNR might take priority. However, for creative projects or marketing materials, SSIM’s insights into perceptual quality may be more relevant. Combining these metrics with human feedback creates a well-rounded evaluation process.
Adding Human Evaluation
While automated metrics are essential, they can miss subtleties like color balance, emotional resonance, or contextual relevance. This is where human evaluation comes in. By using a consistent rating system, human reviewers can assess factors such as sharpness, overall quality, and visual appeal. Comparing these assessments with automated scores can reveal discrepancies, offering deeper insights and opportunities for refinement.
How ImageUpsize Uses Quality Metrics

ImageUpsize combines both automated metrics and human evaluation to enhance image quality. By integrating PSNR and SSIM into its AI enhancement process, the platform ensures sharp details and natural structures are preserved during upscaling - up to 6× magnification. This approach avoids overprocessing, striking a balance between technical accuracy and visual appeal.
Moreover, ImageUpsize operates within a secure, privacy-first framework. All image processing is completed within one hour, after which the files are automatically deleted to protect user data. This ensures users receive high-quality, well-evaluated images without compromising their privacy or security.
Choosing the Right Metric for Your Project
Deciding between PSNR and SSIM comes down to understanding what matters most for your project. Your priorities will help determine which metric gives you the feedback you need. Let’s break down how each works in practical scenarios.
If your project demands extreme precision - like medical imaging, scientific studies, or archiving historical materials - PSNR is the better choice. Its pixel-level accuracy ensures fine details are preserved. On the other hand, if your focus is on creative content or visuals meant for human audiences, SSIM is more suitable. It evaluates images based on how we perceive them, making it perfect for applications where visual appeal matters most.
Budget and time constraints also play a role. PSNR is quicker and less resource-intensive, making it great for real-time tasks. SSIM, while slower due to its more complex calculations, provides a deeper look at structural and perceptual quality.
For quick, automated checks, PSNR’s straightforward results are ideal. But if you need a more detailed quality evaluation, SSIM goes further by analyzing brightness, contrast, and structure - key factors in how humans judge image quality.
ImageUpsize uses both metrics in its enhancement algorithms. This ensures that upscaled images not only retain sharp details but also look natural, even when enlarged up to six times their original size. By combining these metrics, the tool balances technical precision with visual appeal.
Using both metrics together offers the most complete evaluation. PSNR pinpoints technical flaws and ensures mathematical accuracy, while SSIM captures the visual qualities that make an image pleasing to the eye. Ultimately, your project goals should guide your choice, but blending insights from both metrics often leads to the best results.
FAQs
What is the difference between PSNR and SSIM, and how do they work together to evaluate image quality?
PSNR vs. SSIM: Understanding Image Quality Metrics
PSNR, or Peak Signal-to-Noise Ratio, is all about numbers. It measures the mathematical difference between an original image and its altered version. While it gives a precise, numerical assessment of how much an image has changed, it doesn’t necessarily reflect how humans perceive that change.
SSIM, or Structural Similarity Index, takes a different approach. It focuses on visual perception, analyzing factors like luminance, contrast, and texture. These are the elements that closely align with how our eyes judge image quality.
Using PSNR and SSIM together offers a balanced way to evaluate images. PSNR pinpoints the level of errors, while SSIM ensures the image still appears natural and visually pleasing. This combination is especially useful when assessing AI-enhanced or upscaled images, giving a clearer picture of both technical accuracy and visual appeal.
When should you use SSIM instead of PSNR to evaluate image quality?
SSIM stands out as a more effective metric than PSNR for evaluating image quality, especially in scenarios where structural similarity and perceptual accuracy are key. While PSNR zeroes in on pixel-by-pixel differences, SSIM takes a broader approach by assessing how well an image preserves structural details and aligns with the way humans perceive visuals.
This makes SSIM particularly valuable for tasks like evaluating AI-generated images or improving high-resolution visuals, where maintaining structural integrity is essential. PSNR, on the other hand, can fall short in reflecting perceived quality since it doesn’t consider how humans naturally process visual information.
What are the drawbacks of using PSNR to evaluate AI-enhanced images?
PSNR (Peak Signal-to-Noise Ratio) has its shortcomings when it comes to evaluating AI-enhanced images. While it focuses on pixel-level differences, it often fails to reflect how humans actually perceive image quality. For instance, PSNR might assign a high score to an image that's blurry or distorted, simply because the pixel differences are small - even though the image looks far from ideal to the human eye.
Another issue is its sensitivity to minor noise. PSNR can overreact to slight noise variations that barely impact the overall visual quality, leading to evaluations that don't align with human perception. For a more reliable assessment, metrics like SSIM (Structural Similarity Index) are often a better choice, as they take into account both the structural and perceptual aspects of an image.